
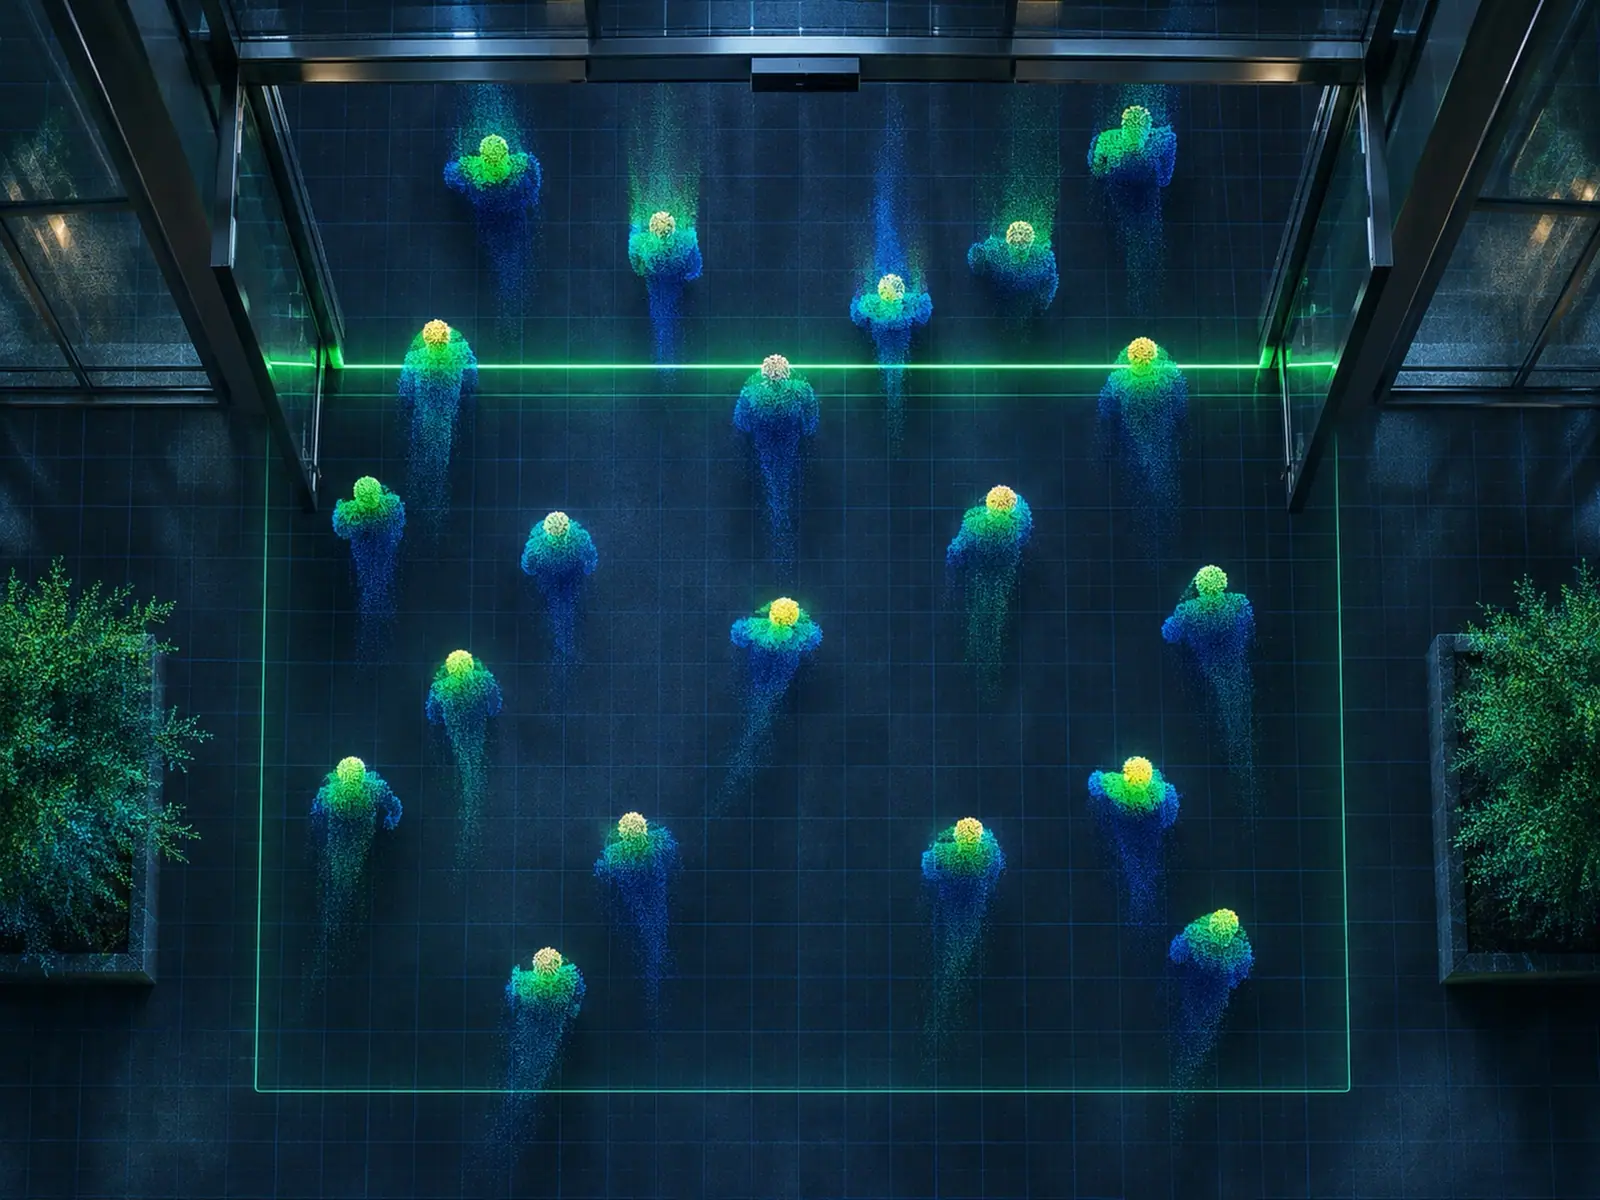
Crowd density in public spaces changes faster than venue teams can see with their own eyes. An event plaza in a mall that was empty ten minutes ago can fill the moment a performer takes the stage. A station platform can fill up when a train runs late. Real-time people counts let the teams managing a space see the same figure at the same time and act on their prepared plans sooner. This article explains what to measure, where to measure it, and how to use the figures together with the safety team.
What Is Crowd Density in Buildings and Event Venues?
In venue operations, the term covers several figures that answer different questions.
| Figure | Meaning | Question it answers |
|---|---|---|
| Occupancy | The number of people in the space right now | How many people are in the hall or the event at this moment? |
| Density | People in the space ÷ the area people can actually use | How tightly packed are people at that spot? |
| Flow rate | The number of people passing a point per minute | Can a gate, walkway or staircase keep up? |
| Direction of movement | People entering, leaving or moving against each other | Are there spots where people cross or turn back? |
| Dwell time | How long people stay at a spot | Where do people stop long enough to create a bottleneck? |
"The area people can actually use" is not the same as the area on the floor plan, because stages, booths, tables, pillars and barriers must be subtracted. Density therefore has to be recalculated every time the event layout changes.
There is no single figure for "too crowded" that applies to every space. The threshold depends on the design of the space, the width of the exits, the type of event and the audience. Setting thresholds is the job of the venue's engineers and safety team, in line with the requirements and permits that apply to that venue. A people-counting system does not set the threshold. It shows how close the space is to the threshold that has been set.
Why Daily Visitor Totals Are Not Enough
A daily visitor report tells you how many people came, but not the peak number of people present at the same time. An event with many visitors over a day may never feel crowded if people arrive and leave gradually. Conversely, a smaller event can become very crowded in certain hours.
Real-time occupancy is calculated with a simple principle.
Occupancy = cumulative entries − cumulative exits (counted at every entrance and exit)
Example (hypothetical figures): from opening until 7 pm, 12,000 entries and 10,800 exits were counted, so 1,200 people are in the event at that moment.
This principle works when three conditions are met.
- Count every entrance and exit, including fire doors in use, car-park links and staff doors. Miss one and the figure drifts further off all day
- Reset the starting value every day, for example when the space closes, so small errors do not carry over from one day to the next
- Validate accuracy on crowded days. Counting accuracy depends on mounting height, the sensor's field of view and how dense the crowd is. The day you need the figure most is the day it is hardest to count, so test under those conditions
For spaces without clear doors, such as a central mall atrium or the area in front of a stage, 3D sensors mounted above the space count the people within their coverage directly, with no need to work it out from entries and exits. See how they work in how 3D people-counting sensors work
Where to Measure in Each Type of Space
| Type of space | Where to measure | What teams usually need to know |
|---|---|---|
| Shopping centres | Main entrances, event plaza, escalator landings, food court, car-park links | How crowded is the plaza during an event? Is the crowd spilling into the main walkway? |
| Bus and rail stations | Fare gates, platforms, stairs and escalators, interchange links | Can the platform take more people when a train is delayed? |
| Convention and exhibition centres | Hall entrances, seminar rooms, corridors between halls, registration points | Is the seminar room full? Which hall is quiet? Where should another entrance open? |
| Concerts, festivals, outdoor events | Entry gates, screening points, front of stage, food areas, toilets, exits | How close is the event to its permitted capacity? Is the crowd bunching at the stage? |
| Museums, libraries, public buildings | Entrances, exhibition rooms, narrow corridors | Should entry to an exhibition room be paused for a while? |
For airports and stations with continuous queues and checkpoints, see managing queues and passenger flow in airports and transport hubs
Set Watch Levels Together With the Safety Team
Data is useful when it is tied to a plan the team agreed in advance, not a number on a screen that each person interprets differently. An easy approach is to define levels, with the venue's safety team setting the figure for each level.
| Level | Meaning | Examples of what the team does according to plan |
|---|---|---|
| Normal | Occupancy below the watch level | Routine patrols |
| Watch | Approaching the set threshold, or rising unusually fast | Send staff to check on site, prepare to open more entrances or exits, inform related teams |
| Act | The set threshold is reached | Follow the agreed plan, such as slowing entry, rerouting walkways, informing attendees |
Points to keep in mind when setting levels
- Use both level and speed. A count that rises very fast in a few minutes is a signal worth watching, even before it reaches the threshold
- Set levels per location. The area in front of a stage and a walkway have different thresholds
- State who does what. Each level needs a named role and a clear communication channel
- Review after every event. Check whether the levels warned early enough or too often
Using the Data Before, During and After an Event
Before the event
- Review data from previous events of the same type: when the most people were present at once, and how long people stayed
- Plan the number of staff, screening lanes and entry lanes around the expected peaks
- Check that sensors cover every entrance and exit, including those opened only on event days
During the event
- Show live occupancy on screens in the control room or command post so every team sees the same figure
- Use the figures to inform decisions to open more entrances, adjust walkways or direct attendees to quieter areas
- Send staff to check any spot where the figures look unusual, because the figure shows that a spot is crowded, not why
After the event
- Review the occupancy curve across the day against the team's incident log
- Find recurring bottlenecks to improve the layout next time
- Use the data in discussions with organisers and sponsors about attendance. See how to measure events in measuring campaigns and events in shopping centres
Data Supports the Team, It Does Not Decide for Them
A people-counting system sees numbers, not context: older people or wheelchairs in the area, rain driving people indoors, or a fight breaking out. Decisions to slow entry, close a route or evacuate therefore belong to the incident commander and the safety team, following the venue's plan. The data helps the team see the situation faster and more consistently.
Prepare a fallback as well. If the network or system fails during an event, the team must be able to switch back to manual counting and communication immediately.
Anonymous Measurement
Managing crowd density does not require knowing who is in the space, only how many. Xovis 3D sensors process data on the device and output numerical data, such as counts and coordinates, with no biometric or personal information. Read more in people counting and PDPA
See Real-Time Occupancy With IMAS
IMAS is a partner of Xovis, the Swiss developer of 3D sensors used in airports, public transport, retail, buildings, museums and events.
- 3D people counting counts entries and exits in real time, measures occupancy, detects queues as they form and tracks where people gather
- Indoor and outdoor installation, with models for standard ceilings, high-ceiling halls and outdoor areas depending on the model, and multiple sensors can be linked to cover a large area as one seamless zone
- Sends data over standard protocols to other systems, such as control-room screens or systems the team already uses
- XPERIO dashboard combines entries and exits from multiple entrances into one view, shows real-time occupancy, and keeps historical data for comparing events
See use in high-traffic passenger areas on the airports and transport hubs page, solutions for shopping malls, and examples on the our projects page
Frequently asked questions
−How many people per square metre is dangerous?
There is no single figure for every space. The threshold depends on the space's design, exits, the type of event and the audience. It should be set by the venue's engineers and safety team in line with the requirements that apply to that venue. A people-counting system shows where the space stands against that threshold right now.
+How is occupancy different from visitor count?
Visitor count is the cumulative number of people who entered over a period. Occupancy is the number of people present at the same time, right now. Crowd-density management relies mainly on occupancy.
+Can a people-counting system close gates or stop entry by itself?
This article recommends that the system shows the figures and people make the decisions, because closing routes or slowing entry affects safety and needs on-site context.
+Does it work for outdoor events?
Yes. There are sensor models for outdoor areas, but mounting points, power and network must be planned around each event site.
+Do I need cameras that see people's faces?
Not necessarily. 3D sensors process data on the device and output numerical data without identifying individuals.
Want to See Real-Time Occupancy in Your Space?
The IMAS team helps survey the site, place sensors to cover every entrance and exit, and set up screens that operations teams can actually use. Details and costs are provided in a quotation.
References
- Xovis AG. Sensor technology, Selection Guide (July 2026) and airport, retail and transportation solution pages. Website xovis.com
- CountMatters AS. XPERIO analytics platform: People Counting and industry pages. Website countmatters.com