
Shopping mall event measurement that people can trust has to answer more than "was it busy that day?" What management, tenants and sponsors really want to know is how many extra people the event brought compared with a day without it, how long they stayed, and what nearby stores gained. This article explains a seven-step method for measuring in-mall events and marketing campaigns with visitor data: setting a baseline, defining the areas, measuring lift, checking the effect on stores, adjusting for outside factors and reporting the results. It includes a worked example with hypothetical figures and a checklist.
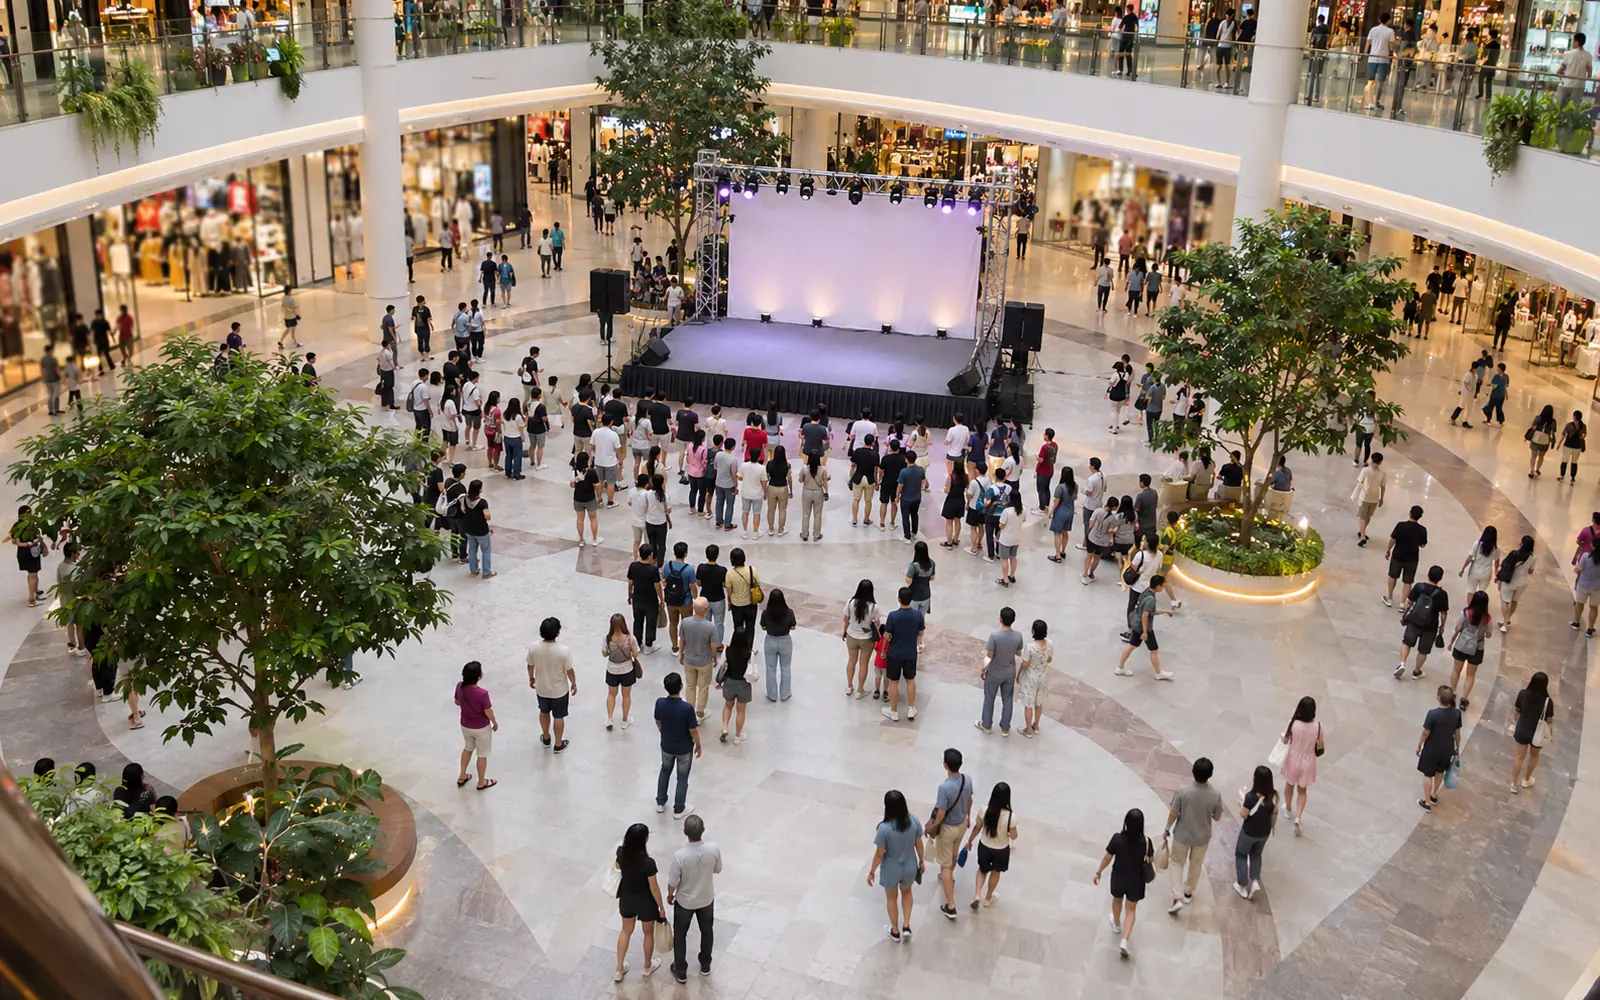
Why Photos of a Busy Atrium Are Not Enough
A photo of a packed atrium at the peak looks impressive but says little. The atrium may be full because people already in the mall walked over to watch, not because they came for the event. That day may also be payday, when the mall is busier anyway. A sound evaluation of a promotional activity therefore compares the result with "how many people would have come without the event", and looks at both the event area and the whole mall.
Counts from people-counting systems at the entrances and zone entrances can answer this, because they measure the same way every day, so a historical baseline is always available. For an overview of how shopping malls use footfall figures, see What Is Footfall?
Step 1: Set the Questions and KPIs Before the Event Starts
Agree before the event what will be measured and what counts as success. If this is decided afterwards, teams tend to pick the figures that look best.
| Question | KPI |
|---|---|
| Did the event bring more people to the mall? | Lift in whole-mall entries against the baseline |
| How interested were people in the event? | Entries to the event zone and dwell time in the zone |
| Did stores benefit? | Passers-by and store visitors for defined store groups |
| Did people spread through the mall? | Visitors per floor and escalator counts |
| What did sponsors get? | Passers-by at the booth and dwell time in front of it |
Step 2: Set a Baseline from the Same Weekday in Previous Weeks
The baseline is the number of people you would expect without the event. A simple method that is easy to explain:
- Use the same weekday. For a Saturday event, compare with Saturdays, not Fridays or the weekly average.
- Use several previous weeks, for example four to six, and take the average or median to reduce the effect of unusual days.
- Remove unusual weeks, such as long weekends, weeks with another event, or days when the counting system had a fault.
- If you have last year's data, check the matching dates as well, taking care with festivals that move each year.
- In a group with several malls, a mall without an event on the same day can serve as a control. If the control mall also rose, part of the increase came from outside factors.
Step 3: Define the Areas to Measure
Measure at least three levels and define the boundaries before the event.
- Whole mall Counted at every entrance and exit, including skywalks from train stations and car parks. This answers whether the event brought more people to the mall.
- Event zone Counted at the zone entrances or with sensors covering the event area. This answers how interested people were in the event.
- Store groups For example, stores around the event zone, stores on other floors, and the food zone. This answers whether the effect reached the stores.
A note on event attendance counts: a counting system at a zone entrance counts "entries". Someone who walks in and out of the atrium three times is counted three times. This figure works well for comparing against the baseline and between events, but it is not a count of unique people. In reports, call it "entries to the event zone" so the label matches what was measured.
Step 4: Measure Lift
Lift = actual count on the event day − baseline Lift (%) = lift ÷ baseline × 100
Calculate lift for both the whole mall and the event zone, then compare them.
- If the event zone rose sharply but the whole mall rose only slightly, the event mostly "moved" people who were already in the mall to the atrium rather than bringing new people in. That can still be useful if the goal is longer visits, but do not report the event-zone figure as the number of people the event brought to the mall.
- If the whole mall rose clearly and some entrances rose more than others, those entrances show how people who came for the event arrived. Use this to place signs and media next time.
Look at the hourly data too. An event with scheduled performances should show peaks around each show. If it does not, people may not have come for the performances.
Step 5: Check Dwell Time and the Effect on Nearby Stores
Visitor counts show that people came. Dwell time shows whether they were genuinely interested or just passing through. Look at the median dwell time in the event zone and compare it with normal days in the same area. How to read this figure is covered in What Is Dwell Time in Malls and Stores?
The effect on nearby stores (spillover) is what tenants care about most. You can see it from:
- Passers-by in front of stores in each group defined in step 3, against each group's own baseline
- Store visitors for stores with people counting, or stores willing to share their figures
- Visitors going to upper floors If the event is on the ground floor and upper floors gained nothing, people came for the event and left.
Stores that also share transaction counts can see one step further: whether conversion rate changed. Sometimes store visits rise but conversion falls, because the people brought in by the event are not yet the store's customers. See how to calculate it in How to Calculate Conversion Rate for Physical Stores
Step 6: Adjust for Weather, Holidays and Payday
Visitor numbers in Thai malls move with many factors unrelated to the event. Check each one before drawing conclusions.
| Factor | Possible effect | How to handle it |
|---|---|---|
| Heavy rain or extreme heat | People may visit malls more or less, depending on location and transport | Compare with days of similar weather in the mall's own history, and note it in the report |
| Long weekends, school holidays, festivals | The whole day's pattern changes | Do not use these periods as a baseline for normal days; compare with the same period last year instead |
| Payday | Visitor numbers may differ from other days; check the mall's own history | Compare with earlier paydays without events, then remove that effect |
| Another event or promotion on the same day | The effects of the two are mixed | State it in the report, and do not split the effect unless it can genuinely be split |
| Closed entrances or repairs | Some entrance counts drop abnormally | Check building logs and read results from entrances that operated normally |
If the adjustment is uncertain, report the figures before and after adjustment side by side with the reasoning. That is better than choosing one figure that looks good.
Step 7: Report to Tenants and Sponsors
A good report is short, uses words that match what was measured and states its limits clearly.
For mall management: whole-mall lift (before and after adjustment), entries to the event zone, dwell time in the zone, spread to other floors, and what to change for the next event.
For tenants: passers-by in front of their store group against the baseline, the busiest periods, and recommendations for the next event, such as when to add staff. Stores with their own people counting can compare against their own KPIs. See the set of KPIs stores can use in 8 Retail Store KPIs to Review Every Week
For sponsors: passers-by at the booth, entries to the event zone and dwell time in the zone, broken down by day and time.
Shared data should be aggregate figures, not individual-level data, and one tenant's sales figures should never be shown to another tenant.
Example: A Saturday Atrium Event at a Shopping Mall
The figures below are hypothetical to illustrate the method. They are not data from any real mall.
A mall holds an event in its ground-floor atrium on Saturday and Sunday. The team sets the baseline from three previous normal Saturdays (39,000 · 40,000 · 41,000 people), giving an average of 40,000, and removes a Saturday that fell on a long weekend. This event coincides with a payday weekend. The mall's own history shows that payday Saturdays without events have about 5% more visitors than normal Saturdays, so the adjusted baseline is 42,000.
| Item (Saturday) | Baseline | Event day | Lift | How to read it |
|---|---|---|---|---|
| Whole-mall entries (unadjusted) | 40,000 | 46,000 | +6,000 (+15%) | Includes the payday effect |
| Whole-mall entries (adjusted for payday) | 42,000 | 46,000 | +4,000 (about +10%) | The part likely due to the event |
| Entries to the event zone | 6,000 | 14,000 | +8,000 | About half were people already in the mall |
| Dwell time in the event zone (median) | 4 minutes | 11 minutes | +7 minutes | People genuinely stopped to watch |
| Store visitors, stores around the ground-floor atrium | Group baseline | +12% | – | Stores around the atrium clearly benefited |
| Store visitors, stores on floors 3–4 | Group baseline | +1% | – | Almost nobody went upstairs |
| Food zone entries | Zone baseline | +8% | – | People stayed on after the event |
What the team concluded:
- The event brought about 4,000 extra people to the mall on Saturday, not 8,000 as the event-zone figure might suggest.
- People who came stayed much longer in the event zone, and stores around the atrium and the food zone benefited.
- Upper-floor stores gained almost nothing, so for the next event the team will move some smaller activities upstairs and measure again with the same method.
On Sunday there was heavy rain in the afternoon, and whole-mall entries rose much less above the baseline than on Saturday. The team did not combine Sunday with Saturday. It reported Sunday separately with a note about the rain, because the effect of the rain could not yet be separated from the effect of the event.
Checklist for Measuring Mall Marketing Campaigns
| Phase | Task | Done |
|---|---|---|
| Before the event | Set the questions, KPIs and success criteria | ☐ |
| Before the event | Choose baseline days (same weekday in previous weeks) and remove unusual days | ☐ |
| Before the event | Define the event zone, store groups and entrances to watch | ☐ |
| Before the event | Check that sensors at every entrance and in the event zone are working | ☐ |
| Before the event | Share the event calendar with tenants so they can plan staff | ☐ |
| During the event | Log incidents such as show times, rain or closed entrances | ☐ |
| After the event | Calculate lift for the whole mall and the event zone, before and after adjusting for outside factors | ☐ |
| After the event | Check dwell time in the event zone and the effect on store groups | ☐ |
| After the event | Write separate reports for management, tenants and sponsors | ☐ |
| After the event | Record the event in the data calendar for future planning and forecasting | ☐ |
Linking Event Results to Visitor Forecasting
Measuring an event does not end with the report. Data from past events also helps plan the next one.
The visitor forecasting used by IMAS runs on the platform of Retail Insight from Norway. It forecasts hourly store visitor numbers up to 8 weeks ahead from historical visitor counts, sales, seasonality and weather, and the company's own article states that events and promotions are also used as forecast inputs.
In practice, when a mall shares its event calendar in advance and keeps a structured record of past events, stores that use forecasting can plan staff hours for event days before they arrive. The system provides forecasts and recommendations, and the store manager makes the final decision on staffing.
How IMAS Helps Measure Events in Shopping Malls
- 3D people counting Ceiling-mounted sensors count entries and exits by direction in real time at entrances, escalators and zone entrances, track dwell time and crowded spots, and are designed to count without identifying individuals.
- XPERIO dashboard Brings every entrance, floor and zone onto one screen. It compares periods, such as the event day against the same weekday in earlier weeks, and compares locations. It shows passers-by, capture rate and dwell time, and has an AI assistant you can ask in everyday language to explore trends and compare areas.
- Data consulting such as measuring marketing results in shopping malls
The figures help marketing teams, tenants and sponsors see the same results. Decisions on what kind of event to run, where and when stay with the team that knows the mall best. See the overview at Solutions for Shopping Malls and examples at Our Projects
Frequently asked questions
−Which figure should be the main measure of a mall event?
Use the lift in whole-mall entries against the baseline as the main measure, supported by entries to the event zone, dwell time in the zone and the effect on nearby stores.
+How many weeks should the baseline cover?
Use the same weekday from several previous weeks, for example four to six, with unusual days removed. The right number depends on how many holidays or other events fall in that period.
+Is the number of entries to the event zone the same as event attendance?
Not exactly. A counting system at the zone entrance counts entries, so one person entering several times is counted several times. The figure is useful for comparing against the baseline and between events, and should be labelled to match what was measured.
+Can an event still be measured if it rained?
Yes, but compare it with days of similar weather in the historical data and report that day separately with a note. Do not combine it with normal-weather days without saying so.
+Should a mall share the results with tenants?
Yes, as aggregate figures at store-group or zone level. This helps tenants see the value of events and plan staff for the next one. What data is shared depends on each mall's policy.
Want to Know How Many Extra Visitors Your Next Mall Event Really Brings?
The IMAS team helps place sensors at entrances and event zones, set baselines and configure dashboards that marketing teams can use to measure every event. Details and costs are provided in a quotation.
References
- CountMatters AS. Footfall analytics and Visitor intelligence. countmatters.com
- Retail Insight AS (Norway). Forecasting platform information and the article "Predictive staffing transforms store operations". retailinsight.no