
An occupancy sensor is a sensor that tells you whether a space is in use and, in more detailed systems, how many people are in it at that moment. In Thai it is often called a room-presence sensor or a space-utilisation sensor. With many organisations now working in a hybrid pattern, the number of people in an office building varies a lot from day to day. Building managers and facility teams need real figures to answer how much of the available space is actually used, which floors are crowded and which are empty, and whether air conditioning and lighting are running in step with the people who are really there. This article explains what the term means, which metrics to use, where to measure, and how to use the data for space planning, building services and energy management.
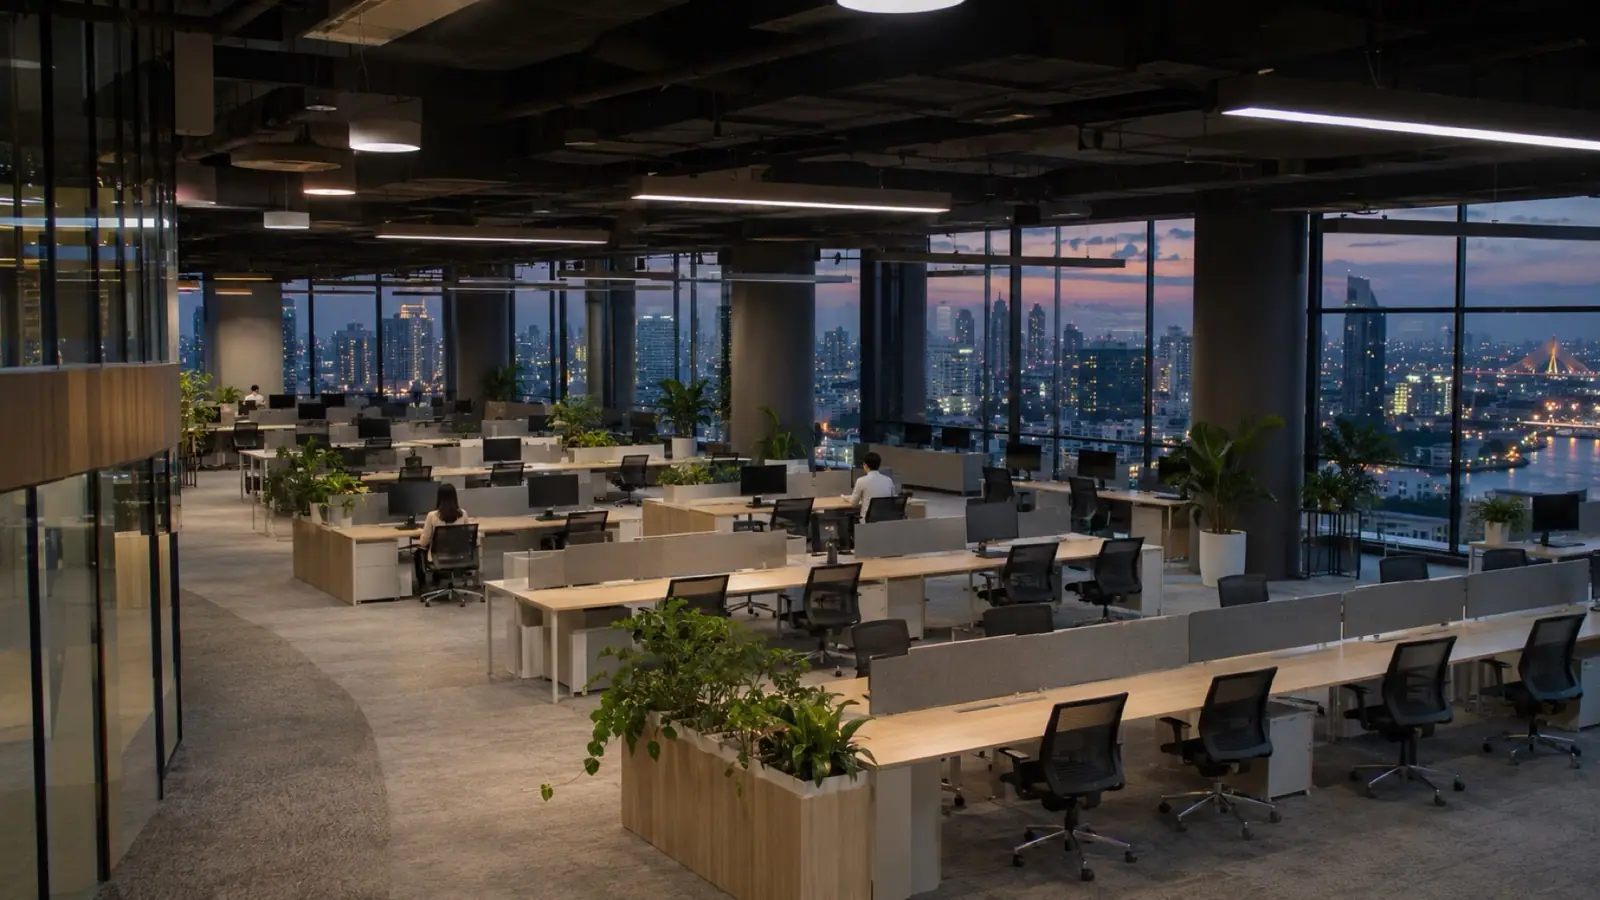
Types of Occupancy Sensor: "Is Anyone There?" vs "How Many People?"
The term occupancy sensor is used for two groups of devices that answer different questions. Separating them clearly at the start makes it easier to choose equipment that fits the job.
Group 1: detecting whether anyone is present (presence detection). An example is a passive infrared (PIR) motion sensor in a meeting room, restroom or corridor. It gives only a "yes" or "no" answer, which suits automatic switching of the lights or air conditioning in that room.
Group 2: counting how many people are there (occupancy counting). An example is a 3D sensor mounted on the ceiling above an entrance, which counts people entering and leaving and calculates how many are in the area at that moment. It gives a number over time, which suits space planning, service scheduling and adjusting building systems to the number of people.
| Aspect | Detecting whether anyone is present | Counting how many people are there |
|---|---|---|
| Answer you get | Occupied or not occupied | Number of people in the area over time |
| Typical installation point | Inside a room or sub-zone | Building entrances and exits, floors or zones |
| Suited to | Room-by-room switching of lights and air conditioning | Space planning, service scheduling, adjusting ventilation to headcount |
| Historical data | Periods when the room was used | Headcount by hour, day and floor |
| Questions it can answer | Is this room free? | What percentage of capacity is this floor using? |
The two groups can be used together. Many buildings already have first-group sensors in their lighting systems, and adding people counting at floor entrances fills in the picture at floor and building level.
How Occupancy Differs from Footfall Counting and Desk Booking
These three terms are often mentioned together, but each gives a different view.
| Data | Meaning | Where it comes from | Questions it answers |
|---|---|---|---|
| Entries (people counting or footfall) | The number of people passing through an entrance in a period, accumulated continuously | People-counting sensors at entrances | How many people entered the building today? Which hours were busiest? |
| People in the space (occupancy) | The number of people in an area at a given moment, calculated as people in minus people out | People-counting sensors that count both directions at every entrance and exit | How many people are on this floor right now? How close to capacity is it? |
| Desk or room booking | The intention to use a space, as booked by staff | The organisation's booking system | How many people are expected tomorrow? Who has booked which room? |
Booking shows the "plan" and occupancy shows "actual use". When the two are placed side by side, facility teams can see the gap, such as a meeting room that was booked but never used, or a day when more people came than had booked. This is a good starting point for adjusting booking rules and seat numbers.
What Is Occupancy Rate, and Which Metrics to Track
Occupancy rate (also called utilisation rate) is the number of people in a space as a share of its designed capacity.
Occupancy rate (%) = people in the space ÷ capacity of the space × 100
Capacity can be counted as the number of workstations or as the number of people the space can accommodate, as the organisation defines it. What matters is using the same definition on every floor and in every month so that figures can be compared.
Four metrics are used most often.
- Peak occupancy. The highest headcount in a day or week. It shows whether the space can handle the busiest periods.
- Average utilisation. The average over working hours. It shows whether the space is well used on a typical day.
- Peak utilisation. The highest headcount relative to capacity. It informs decisions to add or consolidate space.
- Floor-by-floor and day-of-week patterns. These show which days and floors are busiest, so services and system run times can be arranged to match.
Example of Reading the Numbers (Illustrative Figures)
This table uses illustrative figures for one office building over one week. It is made only to show how the calculation works. It is not a customer result or a benchmark for any building.
| Floor | Capacity (people) | Average headcount in working hours | Average utilisation | Peak headcount | Peak utilisation |
|---|---|---|---|---|---|
| Floor 8 (illustrative figures) | 120 | 54 | 45% | 84 | 70% |
| Floor 9 (illustrative figures) | 120 | 90 | 75% | 114 | 95% |
| Floor 10 (illustrative figures) | 80 | 24 | 30% | 44 | 55% |
| Meeting room zone, Floor 11 (illustrative figures) | 60 | 21 | 35% | 57 | 95% |
How to read this illustrative set:
- Floor 9 is almost full at peak times. The next questions are which day the peak falls on and whether any teams could move to another floor.
- Floor 10 is used by less than half its capacity even at peak. It has room for other teams, or could be converted to another use.
- The meeting room zone has a low average but a near-full peak, which means use is concentrated in certain time slots. Looking at the average alone would hide this, so always read the average together with the peak.
Where to Measure in an Office Building
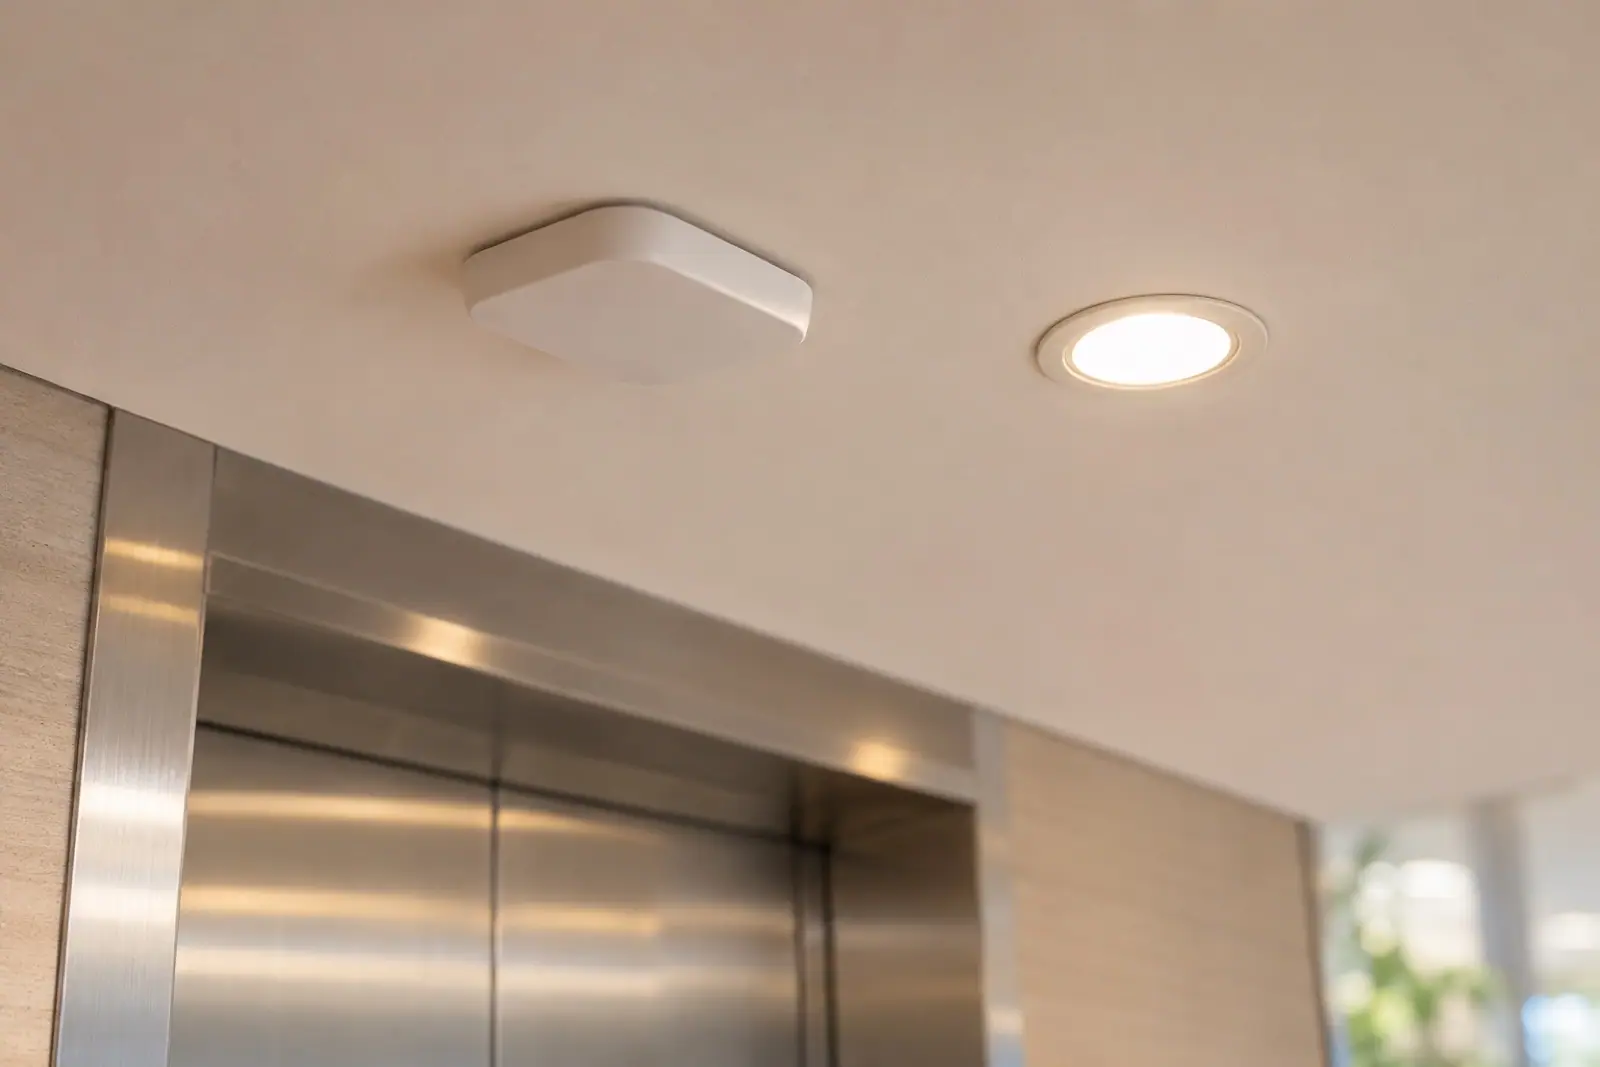
To get a usable headcount for an area, you need to count at every entrance and exit of that area. So where you measure depends on the level of answer you need.
| Measurement point | Data you get | What it is used for |
|---|---|---|
| Building entrances and access gates | Headcount for the whole building over time | Daily overview, arrival and departure peaks, security and reception work |
| Lift lobby | Crowding and lift waiting periods | Scheduling lift service and spotting busy periods |
| Floor entrances, including fire stairs used to move between floors | Headcount by floor | Utilisation by floor, switching systems on and off by floor |
| Meeting room zones and shared areas such as canteens | Headcount by zone | Number and size of meeting rooms, cleaning rounds, food preparation |
In practice, you do not need to measure every point from day one. Most buildings start with the main building entrance and the entrances of the floors they are interested in, then add sub-zones when a question needs a more detailed answer. The questions to ask providers when comparing systems are covered in the article People-Counting System Buying Guide.
One point to raise with providers is how the headcount is calculated as people in minus people out. If an entrance or exit is not measured, or counting errors accumulate, the figure will gradually drift through the day. A system designed for this job therefore has a way to correct the drift, such as resetting the starting value while the building is closed.
What You Can Do with Occupancy Data
1. Space planning
- Decide how much leased space you need using several months of actual usage data, instead of estimating from the headcount on the staff register.
- Set the mix of assigned and shared seats according to the number of people who actually come in on each day of the week.
- Adjust the number and size of meeting rooms when you see which room sizes are fully used and which are used well below capacity.
- Consolidate use onto certain floors on quiet days, such as Fridays or long holiday periods, so the open floors keep a good working atmosphere and the closed floors can have their systems rested.
With enough historical data, you can also forecast building occupancy in advance to plan staffing and resources.
2. Building services
- Clean according to actual use. Restrooms and meeting rooms with heavy use get more frequent cleaning rounds, and areas with almost no one that day can have fewer rounds.
- Schedule reception and security staff around the periods when most people come and go.
- Prepare food and drinks for the staff canteen according to the number of people actually in the building.
- Know how many people are in the building at a given moment. This is supporting information for evacuation drills and emergency management, used together with the building's own headcount procedures.
3. Energy management
Air conditioning, ventilation and lighting in office buildings often run on fixed schedules. With headcount by floor over time, building engineers have more information for the following tasks.
- Set on and off times by floor to match the periods when people actually arrive, including early mornings before work starts and evenings after it ends.
- Adjust fresh-air volume to the number of people (demand-controlled ventilation) in areas where headcount changes a lot, such as large meeting rooms and canteens.
- Find energy use during unoccupied periods, for example a floor with systems running at full output on a day when almost no one came in.
- Look at energy per building occupant alongside energy per floor area, to compare days with many people against days with few.
Adjusting building systems must take into account air quality, occupant comfort and each building's design requirements, so the decision belongs to the building engineers. Headcount data and AI help give a clearer picture. The relationship between energy-metering systems and building control systems is covered in the article What Is a Building EMS?
Occupancy Sensors and the Smart Building
A smart building connects its systems through data so that they respond to how the building is actually used. Headcount is basic data for this idea, because almost every system in a building exists for the people inside. Once you know where people are and when, other systems have information for adjusting how they operate. A building does not need to connect every system at once. Starting with a reliable headcount and using it to support people's decisions is a practical first step.
Privacy of Employees and Visitors
Measuring space use in an office directly involves employees, so privacy should be part of the design from the start. The guiding principle is to measure the space, not the individual.
- Choose technology that counts without identifying anyone. Many ceiling-mounted 3D sensors process data on the device and output only numerical data such as counts, times and direction. Details vary by model and configuration, so ask the provider for documentation on what data leaves the device, where it is stored and who can access it.
- Report at floor or zone level, not down to an individual's desk, and do not link the data to staff access cards or to named booking systems, unless the organisation has assessed this and has a legal basis for it.
- Tell employees what is measured, why, and what is not measured. Clear communication helps staff see that the data is used to improve spaces and services.
- Have the organisation's data protection officer or legal adviser assess the project on its facts before installation.
Details on personal data protection law and each people-counting technology are in the article People Counting and the PDPA. The PDPA is Thailand's Personal Data Protection Act B.E. 2562 (2019).
How to Get Started
- Define the questions you need answered, such as how many floors to renew in the lease, whether the meeting rooms are enough, or which floor can be shut down on Fridays. The questions determine the measurement points.
- Set the scope and define capacity for each floor or zone consistently across the organisation.
- Survey every entrance and exit of the areas to be measured, including stairs and back doors.
- Start with a pilot area: one or two floors, or the main building entrance. Then check the accuracy of the figures against a short manual count.
- Collect data over a full working cycle, including ordinary weekdays, high-attendance days and month-end periods, before drawing conclusions.
- Bring the figures to regular meetings of facility management, HR and building engineers, so the data is actually used in decisions.
- Extend the measurement points to other floors or buildings once the benefits are clear.
IMAS Systems for Office Buildings
IMAS provides 3D-sensor people-counting systems that count people entering a space in real time and track dwell time and crowded points. Sensor data is displayed on the XPERIO platform, which brings the data together in a single dashboard for viewing patterns and tracking results. How to read dwell time and density maps is covered in the article Dwell Time and Heatmaps.
For energy, IMAS works with Saturn Pyro to provide an AI-based building energy management system on the IoTWatt 4.0 platform. This gives office and commercial buildings both data on how people use space and data on energy use to support decisions. The IMAS team assesses the installation scope and data connections for each building on site.
Frequently asked questions
−What is an occupancy sensor?
A sensor that tells you whether a space is in use and, in systems that can count, how many people are there at that moment. It is used both for room-by-room switching of lights and air conditioning and for space planning at floor or whole-building level.
+What is occupancy rate and how is it calculated?
It is the utilisation rate of a space, calculated as the number of people in the space divided by its capacity, multiplied by 100. Look at both the average over working hours and the peak value, because the two answer different questions.
+Can the room-presence sensors used to switch lights on and off measure utilisation?
This type of sensor tells you whether a room is occupied and during which periods it was used, but not how many people were there. To know what percentage of capacity a room or floor is using, you need a system that counts people.
+If we already have a desk booking system, do we still need to measure occupancy?
A booking system shows planned use, while occupancy shows actual use. The two complement each other. Comparing them reveals the gap between what was booked and what was actually used, which helps you adjust booking rules and seat numbers more accurately.
+Does measuring headcount in an office affect employee privacy?
It depends on the technology and its configuration. A system that counts without identifying anyone and reports at floor or zone level can reduce this issue by design. The organisation should tell staff clearly and have its data protection officer assess the project before installation.
Want to know how much of your office space is really used?
The IMAS team can survey entrances and exits, plan measurement points and start from a pilot floor. Details and costs are provided in a quotation.
Talk to the IMAS team · See 3D-sensor people-counting systems · See the XPERIO platform
References
- IMAS Analytics. Information on visitor counting services, the XPERIO platform, visitor forecasting and energy management systems. Website: imas-analytics.ai
- Saturn Pyro Sdn Bhd. IoTWatt 4.0 Digital Energy Audit as a Service. Website: saturnpyro.com
- Personal Data Protection Act B.E. 2562 (2019) (details are in the article on people counting and the PDPA)